Posted by Admin on 22 Sep 2015

Silver Shortages Explained - How Physical Demand has Little Effect on Prices

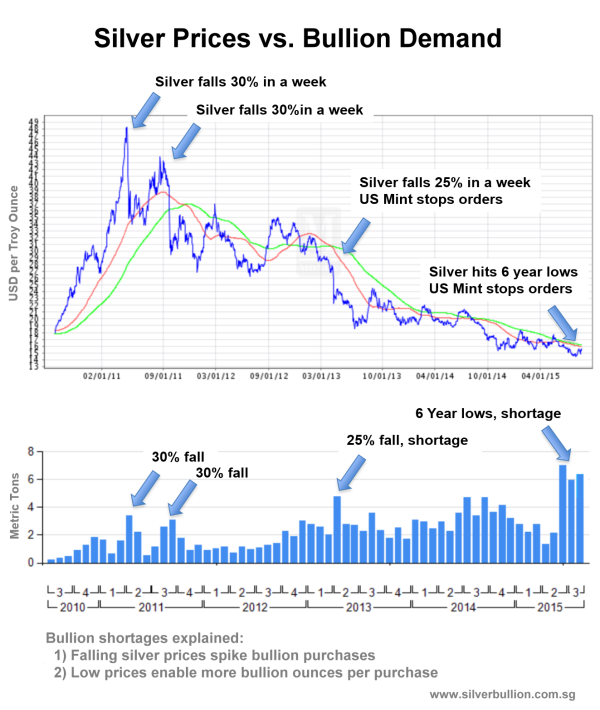
A cursory look at a five year silver price chart reveals wild price swings accentuated by steep and sudden 25% to 30% price drops.

These sudden price drops often begin early on Monday morning Asian time, while US and European exchanges are still closed for the week-end, when trading volumes are low and prices can be more easily moved.

Typically there are no credible news that can explain the selloff, just the sudden paper shorts which utilize 1000% leverage (10 to 1) to sell "borrowed non-existent bullion" (a future short) to quickly push price lower. There is no physical silver sold, these are just leveraged paper positions.

By the time European and, later US markets open, silver would already have fallen considerably and many long positions holders (often small individual investors betting big on higher prices) will be panic selling, stop-loss orders would be triggered, margin calls issued and positions would be automatically sold due to the rapid price fall.

This selling will further fuel the paper sell-off and cause prices to fall further in a vicious cycle which, ultimately, generate huge profits for the short position holders.

These sudden 25% to 30% drops have occurred 3 times over the last five years and have brought prices to 6 year lows despite declining physical stocks and raising demand.

Whether these price falls represent illicit manipulations or not are legal matters that are fought out in the courts of various jurisdictions (see Banks Face U.S. Manipulation Probe Over Metals Pricing) but the fact remains that Silver Prices crashed despite healthy physical demand that exceeded new supplies.

We see this phenomenon because we sell bullion on a day to day basis. The graph below, for example, shows the 5 year silver price in relation to our physical silver bullion orders, expressed as metric tons of silver bullion ordered per month (one ton is 32,150 troy ounces).

Given our international customer base and volume, we believe that these orders are a useful proxy for overall silver bullion demand.
 

Prices vs. Physical Demand


Notice that:
  • Physical demand spikes when prices fall but physical demand seldom affects prices themselves as physical trades represents only a tiny proportion of the highly leveraged future exchanges.  
  • As prices fall buyers receive more bullion per dollar, causing physical supplies to fall faster.
Today, a buyer receives nearly twice as much silver per dollar spent compared to the last large shortage in April 2013 when prices were in the mid twenties, hence physical ounce deliveries are reaching new highs and we see shortages across the industry.

The current shortages are caused by a mint/refinery bottleneck rather than a raw silver shortage, however, as current silver deficits continue we will see raw silver shortages developing.

Above ground known supplies are estimated to be only 40,000 metric tons by Thomson Reuters and the silver deficit this year will be around 57.7 Million ounces - representing an expected 4% decline in reserves.

With silver prices at six year lows and dwindling physical supplies the paper markets are giving us a chance to own an increasingly rare commodity at cheaper and cheaper prices.

The current trends cannot persist. We will either see price increases soon or have much worse shortages accross the industry. Either way, silver is a great value at these prices and is selling fast.