Paper Sets the Price. Physical Sets the Limit.
Silver is down almost 60% from its January record and has largely fallen off the investor radar. A year ago it was the opposite: the physical market seized and the price went from the mid-USD 30s to USD 121 in three months. The two episodes are the same mechanism seen from both ends.
There is a mechanism behind all this. This letter explains it: why the paper price and the physical market are separate things, what sits between them, how a shortage builds, and why a gold-to-silver ratio of 80 makes this a particularly good moment to switch into physical silver.
|
Two Markets Why Paper and Physical Move Apart |
The silver price is set in the paper market. London settles about 145 million troy ounces of silver a day, almost all of it unallocated claims transferred between banks, and COMEX trades contracts for metal that is rarely delivered. Traders in these paper markets reason within their own market understanding: when rates rise, bonds look better than a metal with no yield, so they sell. They do not price a world in which the dollar loses its reserve status or inflates away.
The physical market is where metal changes hands: mints, refiners, industry and investors who want bars and coins. Physical buyers reason that rising inflation and unsustainable debts are the reason to hold metal, so they buy when it looks cheap or when it gets exciting. Because paper volume is many times physical volume, the paper price can keep falling while physical buying rises. Yet ultimately the physical buyer almost always pays the price set by the paper market, plus or minus a physical premium.
In London the two markets are joined at one point: the free float of metal that backs the paper claims. As long as that float is ample, paper sets the price and physical follows, because refiners and industrial users can take delivery from the float. When the float is too thin, the relationship inverts: the paper price has to rise sharply to draw metal in and avoid delivery failures. That is what happened in October 2025, and the rest of this letter is about how far we are from it happening again.
|
London’s Vaults Unallocated, Allocated and Physical |
London held 932 million troy ounces of silver at the end of September, on the LBMA’s own vault data. How that total splits between metal already spoken for and metal that is free is not published; the split below is Metals Focus’s estimate, and the chart sets it against the buffer that ran out last year.
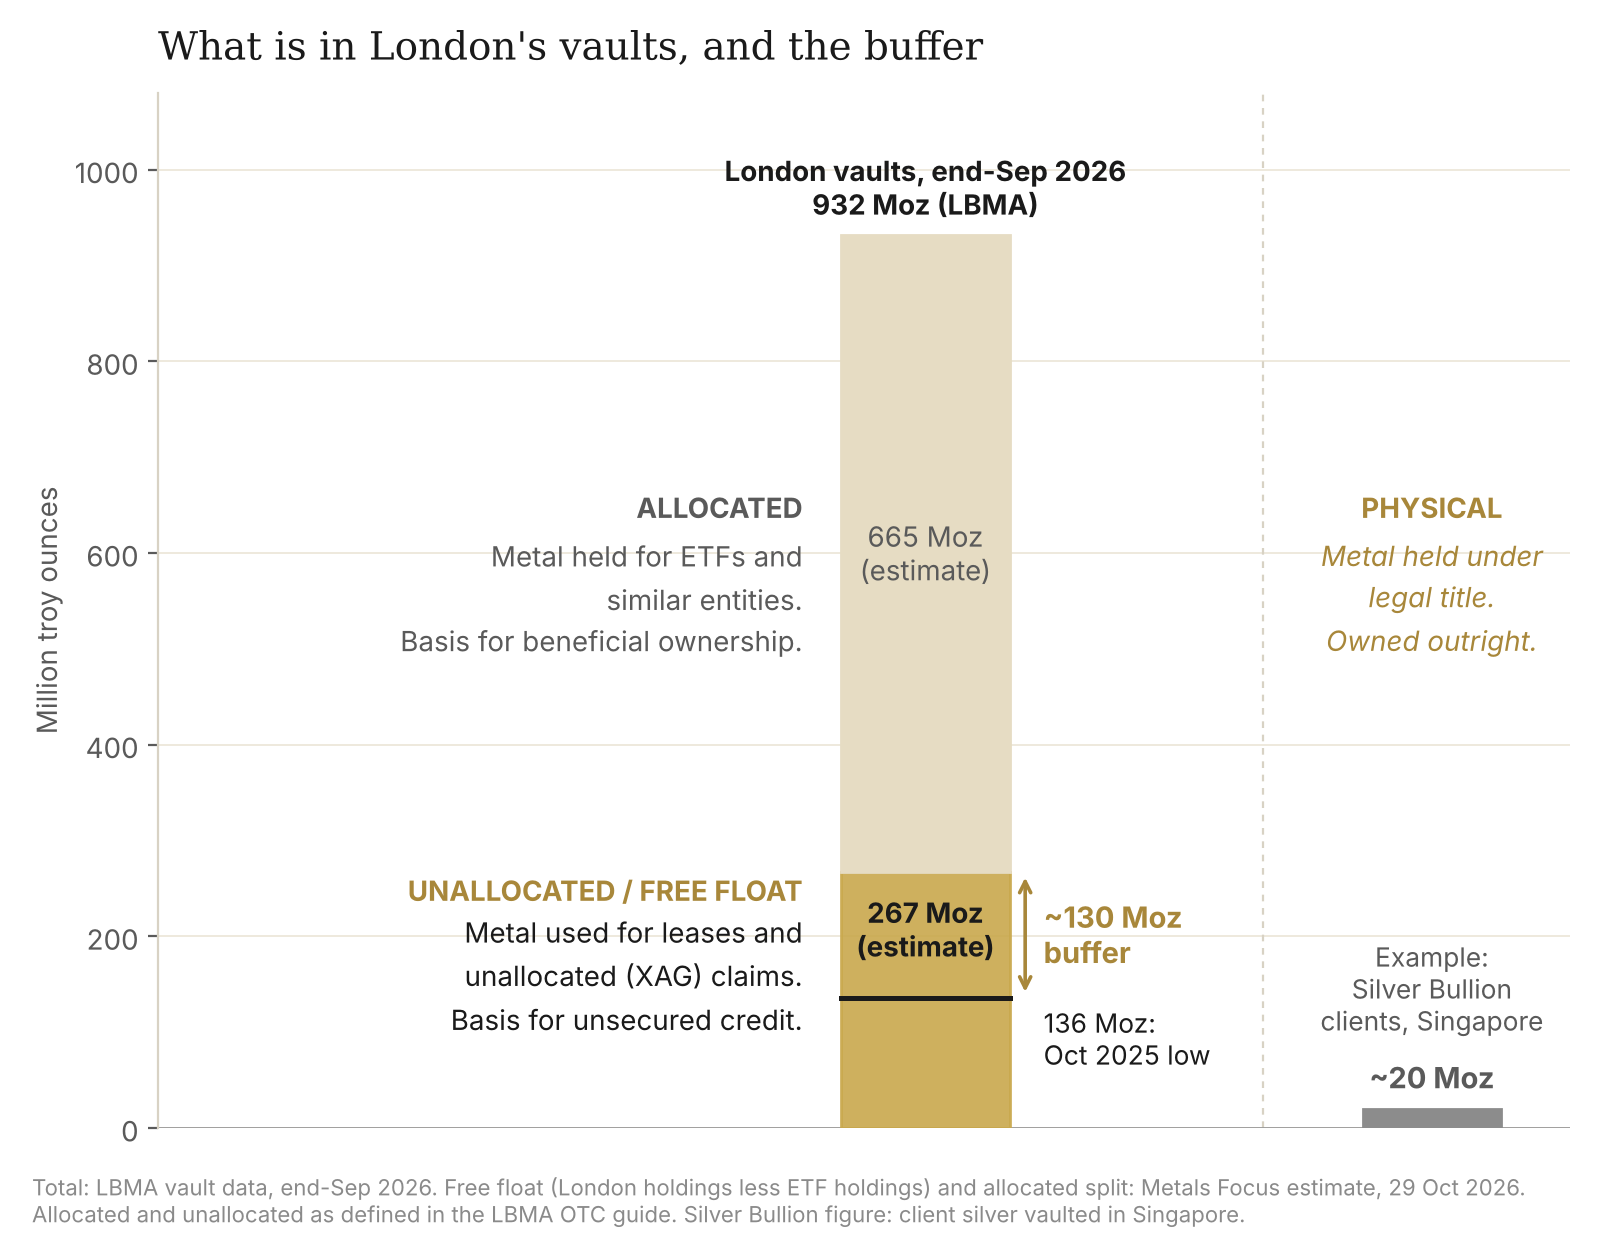 |
| ● | Unallocated: the free float, estimated at 267 million. The bars that back banks’ unallocated silver (XAG) accounts, the form most financial silver takes, and that are lent out to industry. An unallocated holder is an unsecured creditor of the bank, not an owner of bars. This is the only metal in London that can be lent, delivered or sold freely, and how many claims sit on it is not published. The LBMA publishes the 932 million total; the 267 million free float is a Metals Focus estimate. |
| ● | Allocated: estimated at 665 million. Bars held for silver ETFs such as SLV and similar vehicles. The fund’s trustee holds the bars; the ETF shareholder is a beneficial owner, with a claim on the fund rather than title to the metal. Allocated metal is not meant to be lent or used to settle anyone else’s claim, so it adds nothing to the float. |
| ● | Physical: legal title. Identified parcels owned outright, outside the loco London system. Our clients’ silver in Singapore, about 20 million troy ounces, is one example; bullion in a safe deposit box or buried in the garden is another. |
Most readers know that most financial silver is unallocated. The number that might surprise them is how little metal stands behind it: an estimated 267 million troy ounces, of which an unknown amount is already leased out to third parties, against about 145 million troy ounces of unallocated positions settled every day, and an unknown quantity of unallocated silver owed to clients.
|
The Mechanism How a Shortage Happens |
Four things draw the free float down, and all four were running at once last year:
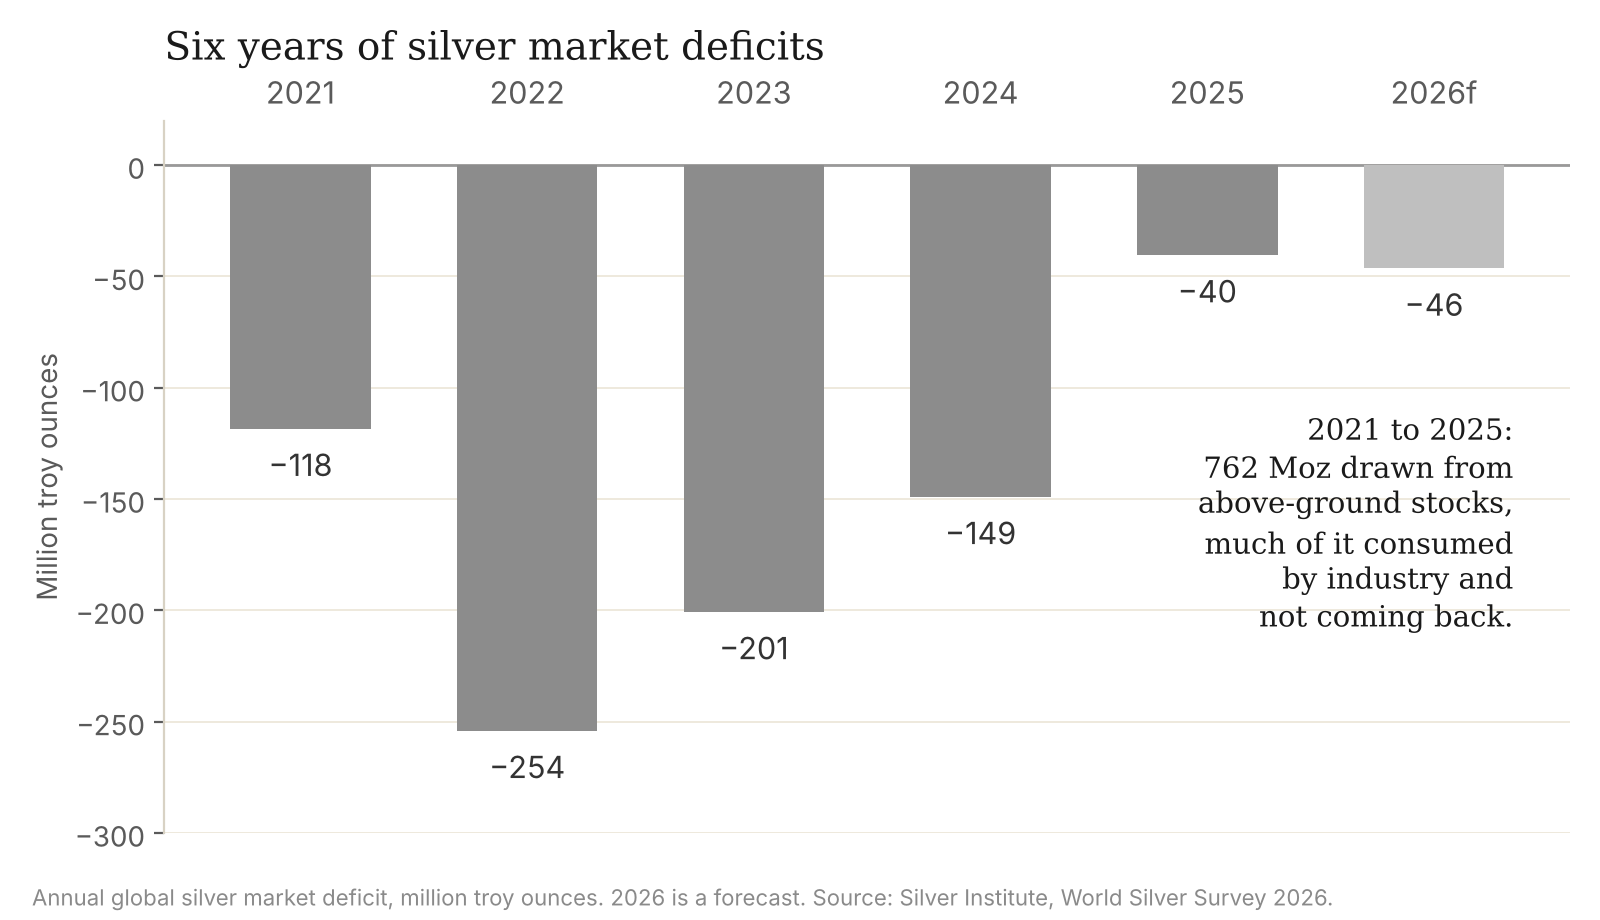
| ● | Industrial deficits. The market has consumed more silver than it produced in every year since 2021, 762 million troy ounces in five years, much of it into solar cells, electronics and alloys from which it is not recoverable. That metal is gone, and the deficit is met from above-ground stocks, of which the London float is the most liquid. |
 |
| ● | ETF purchases. Every ounce an ETF buys is allocated to the fund and leaves the float. It is still in London, but it can no longer back anyone’s unallocated claim and cannot be sold to the industrial users or refiners that need it. |
| ● | Leases. Free-float metal that has been leased to a third party still counts in the vault total, but it is no longer available for delivery or withdrawal by anyone else until the lease is returned. |
| ● | Physical purchases and withdrawals. Every bar or coin bought outright and taken out leaves the London system altogether. |
The first, second and fourth are holders moving from unsecured credit towards ownership, from unallocated to allocated or physical; the third is the banks committing what remains. When enough of it happens at once, the float runs out.
In October 2025 it fell to an estimated 136 million troy ounces. Lease rates went from a fraction of a percent to nearly 40%, premiums on 1,000-ounce bars passed USD 8, and the paper market could no longer set the price: it had to follow the physical one. Silver went from the mid-USD 30s to USD 121 in three months. The physical squeeze was relieved by moving about 48 million troy ounces from COMEX to London, and once it eased, the paper market reasserted itself and the price collapsed.
The collapse was sudden, mechanical and entirely on paper. But it also made momentum buyers sell, and that selling rebuilt the float: leveraged positions were liquidated, silver ETFs shed about 60 million troy ounces, and India was shut out of the market by its own import rules. By the end of September 2026 the free float was back to an estimated 267 million. If 136 million is where the market seizes, the buffer above it is about 130 million troy ounces. It is smaller than the global deficit of any year from 2021 to 2024.
|
Once the float is gone, physical scarcity has to be managed, and the paper market follows physical reality instead of the other way round. |
|
Where We Are The Buffer and the Signals |
The buffer is the whole of the margin between a calm market and last October’s, and it tells you what to watch. Nobody can say when it will be used up, but the drivers above are all visible, and three of them have turned in the last fortnight:
| ● | ETF purchases. Physically backed silver funds added more than 7 million troy ounces on Monday and Tuesday, 2 and 3 November, as the price fell below USD 50. That is about 5% of the buffer in two days. Flows slipped slightly on Wednesday, but there is renewed strength in the ETFs even as paper prices fell, which indicates to us that steady-hand investors are coming back into the silver market. |
| ● | Physical purchases. India, historically the largest physical buyer, relaxed the import restrictions it imposed in May: new six-month quotas running to thousands of tonnes, and the certificate-of-origin requirement removed. More than 300 tonnes arrived in October and Diwali is on 8 November. Western premiums on bars and coins are at or near spot, so the metal is obtainable. |
| ● | Industrial deficits. The Silver Institute’s forecast for 2026 is a sixth consecutive deficit, 46.3 million troy ounces, drawn from the same stocks. |
None of this predicts the timing of the next squeeze, or what prices will do next week, but it describes the buffer and the things that reduce it. Last year the buffer ran out, and the silver price tripled.
|
The Ratio A Signal That Does Not Depend on the Buffer |
The gold-to-silver ratio briefly touched 80 this week, the level at which holders who follow the 80/50 rule exchange gold for silver. It does so without any view on shortages: it measures one metal against the other, and it has added ounces at every turn since 2000. The box sets out the record.
|
The gold-to-silver ratio: one ounce of gold, 26 years 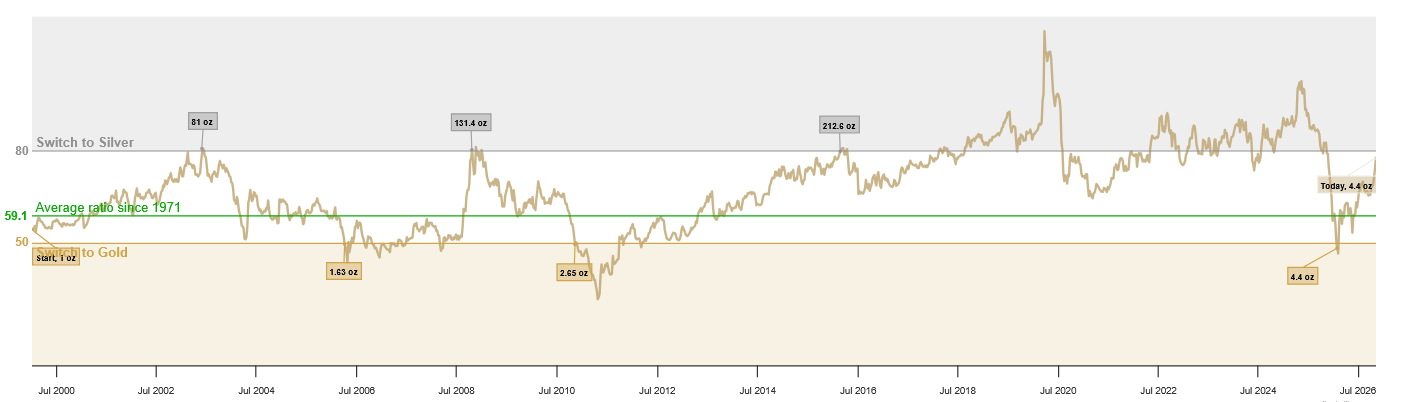
One troy ounce of gold bought on 1 January 2000 and switched between gold and silver at every 80/50 signal is 4.4 troy ounces of gold today. Six switches in 26 years.
The ratio reached 80 early this week and has since eased as silver strengthened. See every switch, the live ratio and today’s signal at silverbullion.com.sg/GoldSilverRatio. Before dealing costs. Past performance is not a guide to future results. |
|
The Strategy What I Am Doing: Silver Coins Now, Gold Bars Later |
The buffer and the ratio point the same way, and for me they combine into a strategy that plays two spreads at once:
| ● | Buy silver coins while demand is low. Coin premiums are cheap when nobody wants them, as is the case now, with the ratio having just touched 80. |
| ● | Hold through the next physical demand spike. When the float runs down and silver runs, coin premiums tend to rise sharply, especially in the United States; in the first quarter of this year American Eagle and Maple Leaf coins commanded premiums of USD 8 to 10 over spot before falling back. Such coins are best bought when premiums are low. |
| ● | Switch into 1 kg gold bars at a ratio of 50. When the time comes, the holder collects the coin premium and the ratio gain in the same trade, switching into gold, which will by then be inexpensive relative to silver, and into low-premium gold bars, whose premiums tend not to rise much. Then wait for the ratio to return to 80 and switch back into silver. |
The ratio never depends on the dollar price of either metal, and it takes patience: the gap between signals has been as long as five years. Personally, I switched around 70% of my gold into silver this week as the ratio came close to 80, primarily into silver coins, whose premiums are good because supply is plentiful now. When the next shortage phase arrives and the ratio reaches 50, I will convert the coins into gold bars, by which time coins are likely to command a premium.
|
What This Means For Holders Be on the Physical Side of the Line |
When the float runs out, the holders who are safe through systemic crises and collapsing institutions are the ones who own metal directly, with legal title. The allocated holder usually has a claim on a fund that owns bars; it is the legal title holder who physically owns the bars.
When MF Global failed in 2011, customers who believed they owned specific gold and silver bars, because they held warehouse receipts bearing the bar numbers, found that they had beneficial ownership only. The metal was part of the estate administered for all claimants: they could not take their bars, received a partial distribution in cash, and waited years for the balance. “Allocated” is not a legal term of art and can be defined freely by anyone; it should not be confused with legal title.
The unallocated holder has a claim on a bank, and in October 2025 the banks were paying 40% a year to borrow the metal they owed, and the spectre of 2008 hangs over us all. The buffer is about 130 million troy ounces today. It was not there a year ago, and the things that consume it have all turned.
Our clients hold legal title under Singapore law to identified parcels of bullion, with Silver Bullion as custodian. We store and insure our clients’ property and provide liquidity on request, and the structure is designed so that we cannot lend, pledge or otherwise use our clients’ bullion. When a client exchanges gold for silver in S.T.A.R. Storage, both metals are physical, both are identified and both stay in Singapore. Metal is subject to the jurisdiction where it is stored, which is Singapore for The Safe House SG, Silver Bullion SG and The Reserve.
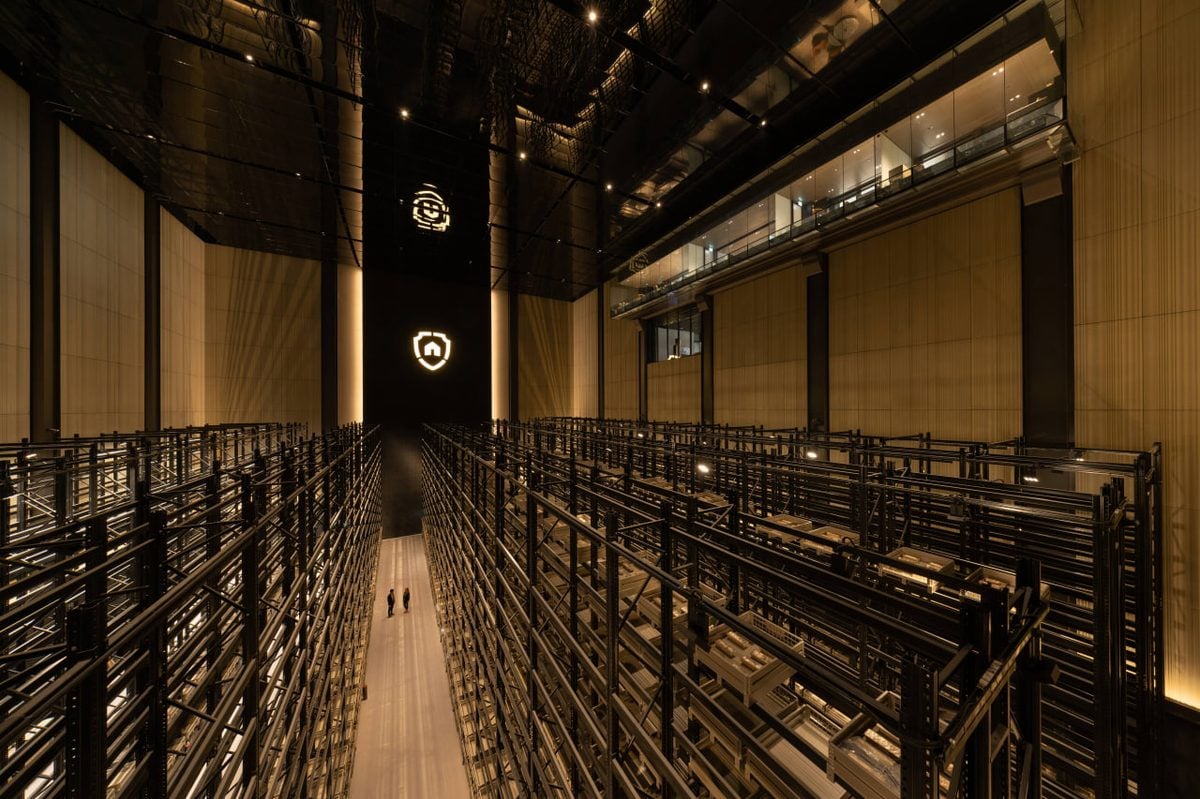 |
| The main silver vault at The Reserve, Singapore. |
The photograph shows our main silver vault at The Reserve in Singapore. Silver is stacked 12 metres (40 feet) high on heavy-duty racking, and the vault can hold about 320 million troy ounces, roughly 30% of annual global silver supply, mine production and recycling combined. We currently store about 20 million troy ounces of client silver there, the grey column in the chart above.
| Regards, |
| Gregor Gregersen |
| Founder & CEO · Silver Bullion Pte Ltd · Singapore |
P.S. On a separate matter of some importance in our industry: the Singapore Bullion Market Association published a statement on 30 October confirming that there is no “LBMA-approved vault” in Singapore, with links to the LBMA’s own pages stating that it does not regulate or approve vaults. Anyone who was told otherwise, or who chose a vault on the strength of such a label, may find it useful. It is linked here: sbma.org.sg/news/clarification-and-apology-crucible-issue-38
Further reading
The Gold-to-Silver Ratio, live chart and switching history
The Jan 30th Silver & Gold Price Crash Is Set to Worsen Physical Shortages (February 2026)
Physical Silver: When Paper Promises Meet Physical Reality (April 2026)
The Last Silver Squeeze Was a Rescue. The Next One Needs a Licence (August 2026)
Unallocated, Allocated & Physical: What You Actually Own (June 2026)
Singapore Bullion Market Association, Clarification and Apology: Crucible Issue 38, 30 October 2026